Demand Forecasting for Seasonal Businesses: A Practical Guide for Hotels, Restaurants and Retail
A practical guide to forecasting covers, room nights and sales in a tourism-driven season: what data you need, which methods to try first, how to measure accuracy, and how to turn the numbers into rotas and orders.
Orya One
Guide8 min read
Key takeaways
- Two to three seasons of daily data plus a holiday and event calendar is enough to start.
- Always build a seasonal naive baseline first; a complex model must beat it to earn its place.
- Measure accuracy with WAPE and bias, not MAPE alone, because quiet days distort MAPE.
- A forecast only pays off when it is wired into staffing, purchasing, pricing and cash decisions.
Demand forecasting for a seasonal business means predicting how many guests, covers or units you will sell on each day or week ahead, so you can decide how many people to roster, how much to order, what to charge and how much cash you will need. For most hotels, restaurants and shops, two to three seasons of daily sales or bookings, a calendar of holidays and events, and a simple model are enough to beat gut feeling.
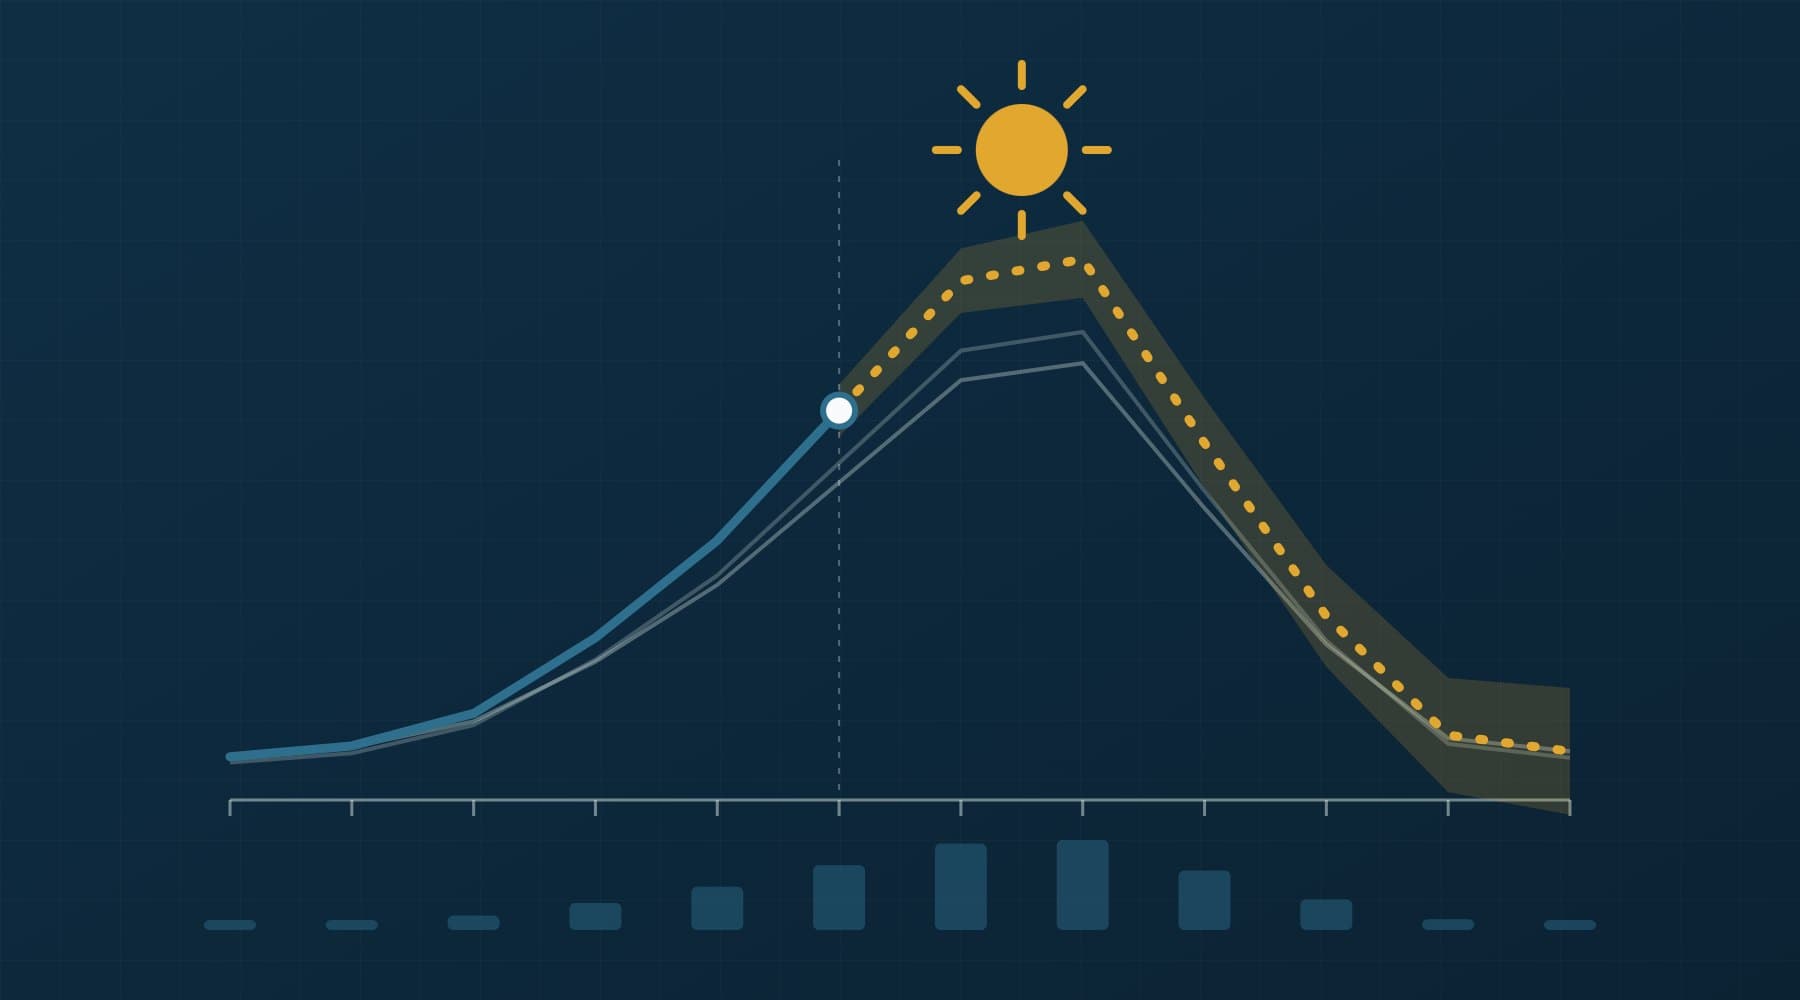
Seasonality in Greece is unusually sharp. According to Eurostat, July and August accounted for more than 40% of tourism nights in Greek accommodation in 2025, against 31% for the EU as a whole, and the busiest month recorded about 20 times the nights of the quietest. Greece ranked second only to Croatia on Eurostat’s seasonality measures. When demand swings that much, a 10% forecasting error in August costs more than a perfect forecast in February saves.
This guide goes from the data you need, through methods from simple to advanced, to accuracy metrics, common pitfalls and a six-week plan to put a forecast into daily use.
What a forecast is actually for
A forecast is not a report. It is an input to four decisions, each with its own horizon and level of detail.
- Staffing: how many people per shift, one to three weeks ahead, by day and service.
- Stock and purchasing: how much to order before the supplier’s lead time, typically days to weeks ahead, by product or category.
- Pricing: when to raise or hold rates, weeks to months ahead. For hotels this is driven by booking pace.
- Cash planning: monthly revenue and cost projections for the next three to twelve months, including the long, quiet stretch after the season ends.
Decide which of these you are solving first. A restaurant fixing its rota needs daily covers by service. A hotel planning pre-season hires needs weekly room nights. The same model rarely serves both well.
The data you need
- Two to three seasons of daily history: POS sales, covers, room nights or units sold. One season cannot separate seasonality from a one-off year. Weekly totals hide the weekday pattern you need for rotas.
- A calendar table: day of week, school holidays, public holidays and long weekends.
- Moving holidays: Orthodox Easter shifts each year: 20 April in 2025, 12 April in 2026 and 2 May in 2027. Clean Monday (48 days before) and Whit Monday (50 days after) move with it. Fixed peaks such as 15 August still need flags.
- Weather: daily temperature and rain for your location. It matters most for beach bars, cafés and terraces, less for city hotels.
- Local events: festivals, concerts, weddings, sports events, cruise calls and new flight routes into your nearest airport.
- Booking pace (hotels and reservations): for every future date, how many rooms or tables were already booked 7, 14, 30 and 60 days before. This “on the books” history is often the single strongest predictor.
Forecasting methods, from simple to advanced
You do not need machine learning on day one. The methods below are listed in order of effort, and each one should be compared against the one before it. The free textbook Forecasting: Principles and Practice by Hyndman and Athanasopoulos is the best reference if you want the theory.
| Method | How it works | Good for | Weakness |
|---|---|---|---|
| Seasonal naive | Forecast = same weekday last year (364 days back) | Baseline for everything | Ignores growth and moving holidays |
| Moving average | Average of the last 4–8 same weekdays | Stable periods, short horizons | Lags behind ramp-up and wind-down |
| Year-over-year with adjustments | Last year × growth factor, with holiday and capacity corrections | Owners who want a transparent rule | Manual; adjustments drift into guesswork |
| Exponential smoothing (ETS) | Weighted level, trend and seasonality that update as data arrives | Weekly or monthly totals, cash planning | Struggles with multiple seasonal patterns and holidays |
| Prophet-style models | Trend + yearly and weekly seasonality + holiday effects | Daily data with clear holidays | Can overfit; needs careful holiday setup |
| Gradient boosting with features | Trees learn from calendar, lags, weather, events and booking pace | Many drivers, several years of data | Needs clean features and disciplined validation |
When to step up a level
Move to the next method only when it beats the current one on held-out data by a margin that matters to a decision. As a working rule, if a gradient boosting model improves WAPE by less than two percentage points over ETS, the simpler model usually wins on maintenance cost. One practical warning on lag features: if you forecast 14 days ahead, the model can only use sales from at least 14 days ago. Using yesterday’s sales during testing gives an accuracy you will never see in production.
Why you always start with a baseline
A baseline is the forecast you would get with no cleverness at all, usually seasonal naive. It sets the bar. Many “AI forecasts” sold to small businesses are never compared with one, and some of them would lose. If your model cannot beat “same weekday last year”, it is not ready.
We built orya-benchmark-pack, an open-source, notebook-first utility, for exactly this step. It runs reproducible baseline analysis on tabular datasets before any deeper modelling, so the comparison is honest and repeatable. For a broader view of where models are worth the effort, see our piece on AI for small business in 2026.
Measuring accuracy: MAPE, WAPE and bias
- MAPE (mean absolute percentage error) = average of |forecast − actual| ÷ actual. Easy to explain, but small actuals inflate it.
- WAPE (weighted absolute percentage error) = sum of |forecast − actual| ÷ sum of actual. Weights big days more, which matches the money.
- Bias = sum of (forecast − actual) ÷ sum of actual. Positive means you over-forecast (waste, idle staff); negative means you under-forecast (stockouts, queues).
| Day | Actual covers | Forecast | Error | Absolute % error |
|---|---|---|---|---|
| Monday | 80 | 90 | +10 | 12.5% |
| Tuesday | 95 | 90 | −5 | 5.3% |
| Wednesday | 120 | 110 | −10 | 8.3% |
| Thursday (rain) | 40 | 50 | +10 | 25.0% |
| Friday | 165 | 150 | −15 | 9.1% |
| Total | 500 | 490 | −10 | MAPE 12.0% |
Absolute errors sum to 50 covers, so WAPE = 50 ÷ 500 = 10%. MAPE is 12%, pushed up by the rainy Thursday where a 10-cover miss counts as 25%. Bias = −10 ÷ 500 = −2%: a slight under-forecast. Report WAPE and bias together. A model with low WAPE but consistent negative bias will leave you short-staffed on your best nights.
Data-quality pitfalls and validation
- Closures and partial days: days you were shut, a POS outage or a private event recorded as zero will teach the model that demand vanished. Flag them and exclude or impute.
- 2020 and 2021: COVID-era restrictions make these years outliers for almost every Greek tourism business. Exclude them or flag them explicitly; never let them define “normal”.
- Promotions and price changes: a happy-hour week or a rate cut lifts sales that will not repeat. Record them as features.
- Stockouts and full houses: sales are not demand. A sold-out hotel on 14 August shows 100% occupancy, not the extra guests you turned away.
- Capacity changes: extra rooms, a new terrace or a second shop change the ceiling. Forecast per unit of capacity or add a capacity feature.
Validate the way you will use the forecast: train on earlier seasons and test on the most recent one, at the real horizon. Then guard the inputs in production. Our open-source orya-guard is a lightweight validation layer that checks datasets and inference payloads, catching missing days, impossible values and schema changes before they quietly corrupt next week’s forecast.
Turning forecasts into decisions
Staffing rota. Convert forecast covers into staff with a productivity ratio you already know. As an illustration, if one server handles about 30 covers per evening service and Friday’s forecast is 165, you need six servers, rounded up. Use the upper end of the forecast range for nights where being short costs more than being over.
Order quantities. A simple rule: order = forecast usage over (supplier lead time + review period) + safety stock − stock on hand − stock already on order. Safety stock should grow with your forecast error, so a better forecast directly frees cash.
| Forecast output | Decision | Who acts | When |
|---|---|---|---|
| Daily covers by service, next 14 days | Rota and shift lengths | Restaurant manager | Weekly, before the rota is published |
| Units by product or category, next 2–3 weeks | Purchase orders and safety stock | Owner or buyer | Before each supplier cut-off |
| Room nights and pickup vs last year, next 90 days | Raise, hold or open discounted rates | Revenue or front office manager | Twice weekly in season |
| Monthly revenue, next 12 months | Cash plan, credit line, pre-season hiring | Owner and accountant | Monthly |
| Forecast range (low/high) | Buffer staff and stock for high-risk days | Manager | Daily in peak season |
Once the forecast exists, put it on the same screen as actuals. The KPIs in our guide to a small business KPI dashboard become far more useful with a forecast line next to them.
A 6-week implementation plan
- Week 1: define the decision. Pick one use case, such as the restaurant rota or hotel pricing, its horizon and its level of detail. Agree how you will judge success.
- Week 2: collect and clean data. Export two to three seasons of daily history. Build the calendar table with Easter-relative dates, holidays and events. Flag closures, promotions and 2020–2021.
- Week 3: baseline. Build seasonal naive and a moving average. Measure WAPE and bias on the most recent season. This is the bar.
- Week 4: better models. Try ETS and, if you have enough drivers, a gradient boosting model with calendar, weather and booking-pace features. Keep only what beats the baseline at the real horizon.
- Week 5: wire into the decision. Produce the forecast in the format the manager uses: a rota sheet, an order suggestion, a pricing alert. Add input validation.
- Week 6: run in parallel and review. Use the forecast alongside existing judgement for a full week or two. Compare both against actuals, then decide whether to adopt, adjust or stop.
How Orya One can help
We are based in Paralia Katerinis, in the middle of a tourism-driven season, so we design forecasts around the decisions owners actually take: rotas, orders, rates and cash. Our machine learning services cover the whole path, from cleaning your history and building an honest baseline to deploying a validated model. The open-source tools mentioned above are the same ones we use to keep that process reproducible, and our selected work shows the platforms we have built.
If you have a few seasons of sales or bookings and want to know whether a forecast would pay for itself, send us a short description. We will tell you plainly whether your data is ready and which method is worth trying first.
Frequently asked questions
What is demand forecasting for a seasonal business?
Demand forecasting for a seasonal business means predicting future sales, covers, room nights or units by day or week, taking into account yearly peaks, weekday patterns, holidays and events. Its purpose is practical: deciding how many staff to roster, how much stock to order, what prices to set and how much cash to hold through the low season. Good forecasts include a range, not just a single number.
How much data do I need to forecast seasonal demand?
Ideally two to three full seasons of daily data, such as POS sales, covers or bookings, plus a calendar of holidays and local events. One season is not enough to separate genuine seasonality from a one-off year. In Greece, exclude or flag 2020 and 2021, because COVID-era restrictions distort them. Hotels should also keep booking-pace history: how many rooms were already booked at fixed lead times.
Which forecasting method is best for a small business?
Start with a seasonal naive baseline, which forecasts the same weekday last year, then try exponential smoothing (ETS). Move to Prophet-style or gradient boosting models only if you have several years of clean data and drivers such as weather, events or booking pace, and only if they clearly beat the baseline on held-out data at the horizon you actually need.
What is the difference between MAPE and WAPE?
MAPE averages the percentage error of each day, so a small miss on a quiet day can look huge and dominate the score. WAPE divides the total absolute error by total actual demand, weighting busy days more heavily, which better reflects money at stake. Most seasonal businesses should report WAPE together with bias, which shows whether forecasts are systematically too high or too low.
How does Orthodox Easter affect forecasting in Greece?
Orthodox Easter moves each year, falling on 20 April in 2025, 12 April in 2026 and 2 May in 2027, and Clean Monday and Whit Monday move with it. A forecast that compares the same calendar dates year over year will misplace the Easter peak. Instead, add features such as days from Easter, or align holiday periods explicitly, so the model learns the holiday effect correctly.